
Share this article
How Finance Borrowed Its Randomness
E very model used to price risk today — Value at Risk, credit-default formulas, Basel's capital requirements — rests on a single inherited assumption: that market movements are random. This article traces how that idea, borrowed from physics and formalized by Bachelier and Wiener, was built up through Black-Scholes, Merton, and Vasicek into the regulatory architecture used today, and how even the 2008 crisis left its foundations untouched.
CREDIT.risk
MARKET.risk
OPERATIONAL.risk
The Probabilistic View of Economics
In the world of economics, the application of statistical models has a long and firmly established tradition. Such models are widely employed across a diverse range of economic applications, and the foundation for their use rests on an accepted and unquestioned paradigm — the randomness of the phenomena observed. It is on precisely this conceptual foundation that the financial safety system was likewise built, one sanctioned by successive regulatory accords (Basel I, Basel II, Basel III/CRR III). A key place within this architecture is occupied by risk models — the tools used for calculating the height of the anti-crisis barrier. These models, whose common denominator is the Value at Risk concept, were themselves derived precisely from this probabilistic conceptual map. Their credibility was, admittedly, shaken during the crisis events of 2008; yet, as can be gathered from the most recent post-crisis regulations proposed by supervisors, the conceptual foundations remained untouched. The idea of observing risk phenomena on the probabilistic map was not called into question.
In the sections that follow, the process will be traced by which economic — or, more broadly, socio-economic — phenomena came to be perceived in precisely this manner, as they are today. The founding idea, it would seem, was the already-mentioned concept of the random walk. Subsequently, by way of Markowitz, Samuelson, Black-Scholes, Merton, Vasicek, and J.P. Morgan, we arrived at the world of economic models we have today. These models are sanctioned by regulators, and, for the past twenty years, have officially told us the story of financial risk.
Download full version of article
DownloadThe Random Walk and the Normal Distribution
As late as the nineteenth century, the value of assets (e.g., stock prices) was understood through two traditions:
(a) The first tradition — the fundamental one. A stock price reflects the value of the company. A company's value depends on its profits, assets, and prospects. A skilled analyst, understanding the company, can predict whether the price will rise or fall.
(b) The second tradition — the technical one. Prices exhibit patterns — trends, resistance levels, support levels. A skilled observer, reading charts, can predict price movements.
The idea of the random walk — known in physics as Brownian motion — was transferred into the world of finance by Bachelier (1900). His work, however, was forgotten, and this idea is best known today under the name of the Wiener process (1923), or simply as Brownian motion. This widely disseminated concept holds that movements in asset values are, by their very nature, random, and follow a stochastic process (that is, a process composed of random variables). At any given moment in time, the value depends on the state at the previous period and on a random movement occurring within the current period. The stochastic process in question unfolds over time. Time, in turn, may be either discrete or continuous. Wiener (1923), who formalized the description of this process, addressed the process in continuous time.
Now, by means of the Central Limit Theorem (CLT), one can, at any given moment in the future, observe a distribution — a normal one — of possible values; that is, a picture of the potential for different possible trajectories to be realized. In the discrete version, however, the process needs more time to form a normal distribution — with a small sample (a short period t), the distribution will not yet be normal. If, on the other hand, continuous time is assumed, then, between the moments t0 and t1, infinitely many small steps are observed. Thus, within any arbitrarily small interval of time, the particle (the price) has taken infinitely many steps, and the CLT has already come into effect. The distribution of the particle's (the price's) position is thus normal for every t > 0. The Wiener process thus holds that the position of the particle at any given moment t is a random variable with a normal distribution. The marginal distribution of the Wiener process is written as follows:
$$
W(t) \sim \mathcal{N}(0, t) \quad \text{for every } t > 0
$$
where W(t) is the value of the Wiener process at time t — that is, the position of the particle (the price) at time t — with the normal distribution described by the following parameters: a mean equal to 0, and a variance equal to the time t (that is, the standard deviation is the square root of the time t).
Black and Scholes (1973) applied precisely this continuous-time version of the random walk process, employing, in their option pricing formula, the heat conduction equation. In doing so, they accepted that the volatility of an asset's price over time could be described mathematically in the very same manner in which the random motion of a physical particle had been described. The distribution of such an asset price change is, accordingly, normal (Strictly speaking, this refers to the normality of the logarithm of the rate of return - geometric Brownian motion. It is useful to understand the rate of return as the change in value over time. In this sense, the normal distribution describes the logarithm of the change in stock price over time.).
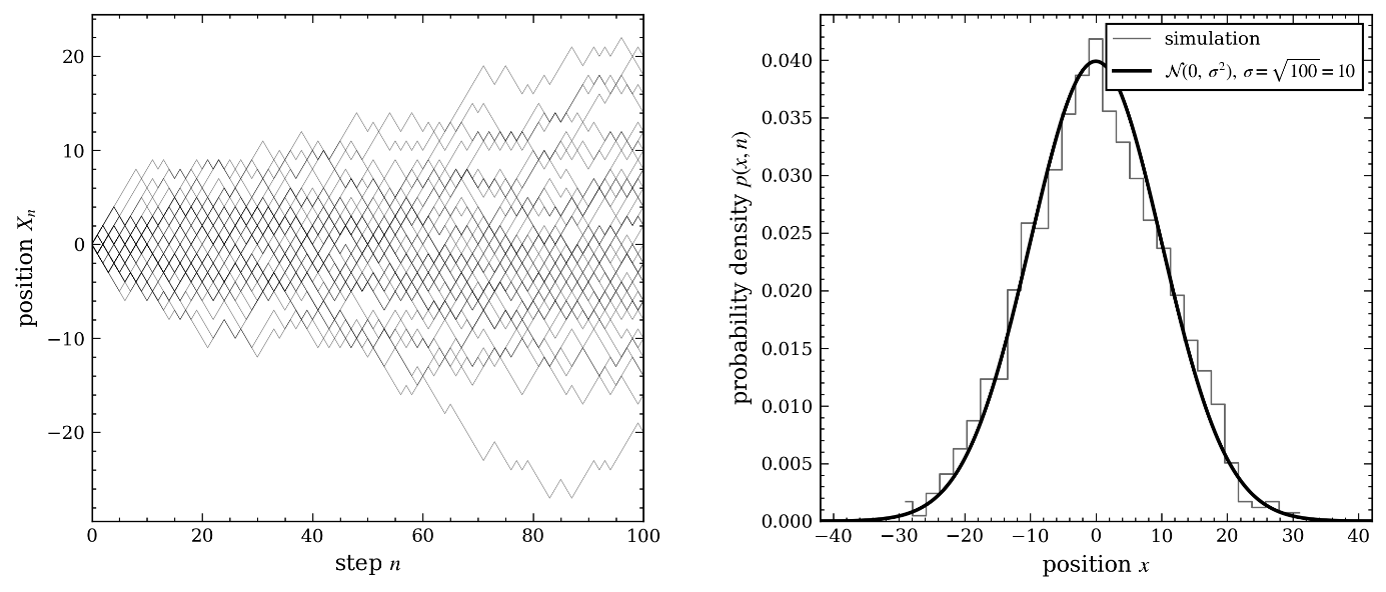
Figure 1: Discrete-Time Random Walk of Particles, Together with the Theoretical Gaussian Curve
Source: Own elaboration.
The Random Walk and the Normal Distribution in Market Risk
In 1996, J.P. Morgan and Reuters (1996), in introducing the Value at Risk concept into the world of finance, placed precisely this random walk process at the foundation of their model, as the description of an asset's rate of return. From this followed the normal distribution they applied as the probabilistic description of the rate-of-return phenomenon; it was on this distribution that VaR values were read, given an assumed confidence level and time horizon. The supervisor, by way of the so-called Market Risk Amendment (BIS, BCBS, 1996), introduced this method into official use. Today, this is precisely how the world models the volatility of the market value of assets.

The Emergence of Credit Instrument Pricing Methods
In the domain of credit risk, a decisive step was taken by Merton (1974). Building on the Black-Scholes model (1973), he formulated a theory for the pricing of bonds under conditions of significant default risk. Adopting a series of simplifying assumptions — the most important being the continuity of price movements (that is, the continuous-time random walk) and the serial independence of unexpected rates of return — he derived a pricing equation describing the value of any given financial instrument as a function of firm value and time.
Merton's key insight was the isomorphism between a firm's capital structure and option instruments. The equity of a leveraged firm is mathematically equivalent to a European call option on the firm's assets: shareholders have the right, but not the obligation, to "repurchase" the firm from its creditors by repaying the debt at maturity. If, at that point, the value of the firm's assets exceeds the value of its liabilities, shareholders repay the debt and retain the surplus; if not, they surrender the firm to its creditors, much as an option holder who chooses not to exercise the option. Default is thus an endogenous event: it occurs precisely when the value of the firm's assets falls below the value of its debt at maturity. From this isomorphism, it was held to follow that the credit risk premium is a function solely of the volatility of the firm's assets and its leverage ratio — with no need to know either the expected rate of return or investors' preferences.
Merton (1974) opened the way for the formation of an entire class of models known as structural models, in which credit risk follows directly from the observed capital structure and asset volatility of the firm. The logic of Merton's model — pricing through portfolio replication, the absence of arbitrage, the isomorphism with options — became the methodological template for the whole of modern credit instrument pricing theory.
Vasicek (1987) extended Merton's model to a credit portfolio. He assumed that the asset value of each borrower depends on two components: a systematic factor (the state of the economy), common to all borrowers, and an idiosyncratic factor, specific to each individual borrower. Vasicek likewise assumed that the portfolio contains an infinite number of small exposures. Under this assumption, idiosyncratic risk diversifies away to zero — only systematic risk remains. Thus, asymptotically, as the number of exposures tends to infinity, portfolio risk depends on a single factor — the systematic component. Hence the name later given to this approach: the Asymptotic Single Risk Factor (ASRF). By virtue of these assumptions, Vasicek derived a closed-form analytical formula for the loss distribution of a homogeneous credit portfolio, as a function of three parameters: the long-run PD, the correlation (denoting the correlation of a given borrower with the systematic factor — that is, with the state of the economy), and the confidence level.
Gordy (2003), for his part, demonstrated that the property of portfolio invariance, underlying the Vasicek model, likewise holds for heterogeneous portfolios — with differing risk parameters across individual exposures — provided the portfolio is asymptotically fine-grained and a single systematic factor exists. This property made it possible to construct the IRB formula, in which capital is calculated additively, loan by loan. Ultimately, the level of credit losses in the IRB model, formulated on these principles, is read off from a normal distribution, at the 0.999 level. It was thus accepted that the loss phenomenon averages out to the shape of a normal distribution. A reading at the 0.999 quantile denotes, in turn, a situation of extremely low probability — the chance of default under an unexpected situation.
In 2004, the regulator, by way of the Basel II regulations (BIS, BCBS, 2004), introduced the IRB framework into the safety architecture. Credit risk models were now built upon this long and consistently constructed tradition.
It is worth adding that other approaches to measuring credit risk exist as well, some fairly widely used. Unlike the IRB model discussed above, these are not models based on a structural approach. They rely, to a far greater degree, on empirical data, and it is on such information that the measurements — and, at times, the probability distributions — are based. These models typically make use of the VaR concept, applied to the final distributions arising within them. Ultimately, then, much like the IRB model, the character of these models remains strictly probabilistic. One example from this group is the CreditMetrics concept, developed by J.P. Morgan (1997). The model's architecture is based on a portfolio approach to risk measurement, an exposure migration matrix, and a VaR measure applied at the end of this construct. Another example is the CreditRisk+ model, developed by Credit Suisse (CSFP, 1997) — an actuarial concept, in which the number of losses is modeled by means of the Poisson distribution. Ultimately, here too, the model's result is read off by means of the Value at Risk measure.
Methods for Operational Risk
It would seem that the framework proposed by the regulator in 2004 (BIS, BCBS, 2004) for the statistical description of operational risk (the AMA method) draws upon several different traditions. In part, on the actuarial tradition — marginal models of frequency and severity; in part, on the tradition described above — the reading of the risk level by way of a distribution quantile, the VaR method; and in part, on the tradition of catastrophe modeling — EVT I, EVT II, Embrechts et al. (1997). The description of the operational risk phenomenon (within the AMA framework) in terms of so-called heavy-tailed (sub-exponential) distributions is itself evidence of the framework's grounding in this third tradition. This method — in operation for twenty years and withdrawn in 2024 — irrespective of which of the aforementioned foundations one traces it to, drew, with certainty, on the assumption of the randomness of the phenomenon it sought to describe. It thus shares the same origin as the methods for describing market and credit risk discussed above — an origin having its roots in the, whether justified or not, "taming of chance."
The Catalog of Methods for Internal Capital Models
For internal capital models (Pillar II — Basel II) (BIS, BCBS, 2004), no dedicated frameworks exist. Such models, however, are most often built using the Value at Risk method. The structure of the phenomenon itself may be described in a variety of ways, and these concepts may thus draw on different traditions. They are, nonetheless, generally concepts grounded in the assumption of the randomness of the phenomena under study.
The Financial Safety Architecture after CRR III
Four years after the Basel II safety framework was established, the greatest financial crisis in a hundred years took place (the 2008 crisis). Following this event, regulators set to work, almost immediately, on reforming the system. This work continued for well over a decade. In 2024, the CRR III package (EU, CRR III, 2024) was published, implementing into force the post-crisis regulatory project known as Basel III Endgame (BIS, BCBS, 2017). At the fundamental level, the regulations did not change substantially.
KEY TAKEAWAYS
The paradigms remained untouched. Regulators and the financial sector continue to view the world through this same conceptual map. The concept of statistically modeling risk — in which the risk phenomenon is perceived as a random phenomenon, a random variable — was not called into question. The financial safety architecture thus remains grounded in a probabilistic method of describing phenomena. We see these phenomena as external and modelable. Risk models, in turn, function as the key objects of this system. ■

Maciej Buczak
Risk management professional with 8+ years validating financial models in banking, currently teaching risk management and econometrics in Warsaw. His research questions the paradigmatic foundations of financial risk architecture — from VaR to AMA and IRB — drawing on extreme value theory.
References Academic sources cited throughout this article — click to expand the full list
Bachelier, L. (1900), Théorie de la spéculation, Annales scientifiques de l'École Normale Supérieure, 3e série, 17, pp. 21-86. English translation: Bachelier, L. (1964), Theory of Speculation, in: P.H. Cootner (ed.), The Random Character of Stock Market Prices, pp. 17-78, MIT Press, Cambridge MA.
Bank for International Settlements, Basel Committee on Banking Supervision (1996), Amendment to the Capital Accord to Incorporate Market Risks, Basel Committee on Banking Supervision, January 1996.
Bank for International Settlements, Basel Committee on Banking Supervision (2004), International Convergence of Capital Measurement and Capital Standards: A Revised Framework. (Basel II).
Bank for International Settlements, Basel Committee on Banking Supervision (2017), Basel III: Finalising Post-Crisis Reforms.
Black, F., Scholes, M. (1973), The Pricing of Options and Corporate Liabilities, Journal of Political Economy, Vol. 81, No. 3, pp. 637-654.
Credit Suisse Financial Products (1997), CreditRisk+: A Credit Risk Management Framework, Credit Suisse Financial Products, London.
Embrechts, P., Klüppelberg, C., Mikosch, T. (1997), Modelling Extremal Events for Insurance and Finance, Springer-Verlag, Berlin.
European Parliament and Council (2024), Regulation (EU) 2024/1623 amending Regulation (EU) No 575/2013 as regards requirements for credit risk, credit valuation adjustment risk, operational risk, market risk and the output floor (Capital Requirements Regulation III — CRR III), Official Journal of the European Union, June 2024.
Gordy, M.B. (2003), A Risk-Factor Model Foundation for Ratings-Based Bank Capital Rules, Journal of Financial Intermediation, Vol. 12, No. 3, pp. 199-232.
J.P. Morgan/Reuters (1996), RiskMetrics™ – Technical Document, Fourth Edition, Longerstaey, J., Spencer, M., Morgan Guaranty Trust Company and Reuters Ltd., New York, December 17, 1996.
J.P. Morgan (1997), CreditMetrics™ – Technical Document, J.P. Morgan & Co. Incorporated, New York, April 1997.
Merton, R.C. (1974), On the Pricing of Corporate Debt: The Risk Structure of Interest Rates, Journal of Finance, Vol. 29, No. 2, pp. 449-470.
Vasicek, O.A. (1987), Probability of Loss on Loan Portfolio, Working Paper, KMV Corporation, San Francisco.
Wiener, N. (1923), Differential Space, Journal of Mathematics and Physics, Vol. 2, No. 1-4, pp. 131-174.


Reader Discussion
Share
your thoughts
Tip: Choose the category that best describes your comment. This may help other readers. See more